Install vnStat on Debian/Ubuntu Server to Monitor Network Traffic
vnStat is an open-source, GPL-licensed, console-based network traffic monitor. It’s lightweight and can be used without root privilege. Traffic statistics is stored in a database and presented per network interfaces. Each interface has its own database. The latest stable version is vnStat 1.1.5.
This tutorial explains how to install vnStat on Debian/Ubuntu server and how to use it.
Install vnSTAT on Debian/Ubuntu Server
vnStat is available from Debian/Ubuntu official repositories.
sudo apt-get install vnstat
The vnstatd daemon will be automatically started after it’s installed. And it will auto start when Debian/Ubuntu is booted up. You can check this out with systemctl.
systemctl status vnstat
Output:
● vnstat.service - vnStat network traffic monitor
   Loaded: loaded (/lib/systemd/system/vnstat.service; enabled)
   Active: active (running) since Sat 2016-04-16 05:58:33 EDT; 1 months 9 days ago
     Docs: man:vnstatd(1)
           man:vnstat(1)
           man:vnstat.conf(5)
 Main PID: 654 (vnstatd)
   CGroup: /system.slice/vnstat.service
           └─654 /usr/sbin/vnstatd -n
“Enabled” means auto start with system boot is enabled.
Create Database for Network Interface
After vnStat is installed on Debian/Ubuntu , a database will be automatically initialized for each network interface. /var/lib/vnstat is the database directory for vnStat.
linuxbabe@xenial:~$ ls /var/lib/vnstat/
eth0 eth1
A new database can be created with the following command. Replace eth0 with the interface that should be monitored.
vnstat --add -i eth0
To remove database for an interface, run the below command. Replace eth0 with the interface that you don’t want to monitor.
vnstat --remove -i eth0
The daemon vnstatd is responsible for data retrieval and storage whereas the vnstat command provides an interface for querying the traffic information stored in network interface specific databases.
If you need to change the interface name, first stop vnstat.
sudo systemctl stop vnstat
Then
sudo vnstat -i eth0 --rename new_name --force
Start vnstat.
sudo systemctl start vnstat
vnstat might tell you that the interface is disabled. Don’t worry, it will be enabled in a few moments.
View Live Network Traffic
To view live network traffic, run this command:
vnstat -i eth0 -l
-i stands for interface. -l stands for live. Replace eth0 with your interface name. Press Ctrl+C to stop.

In the above screenshot, rx means Receive which is incoming traffic and tx means Transmit which is outgoing traffic. You can see how much bandwidth (transfer rate) is being used. All Digital Ocean SSD cloud servers have 1 Gbit network interface. (Create an account with Digital Ocean via my affiliate link, you will get $10 free credit 🙂 )
View Hourly Traffic
Show network traffic of the last 24 hours.
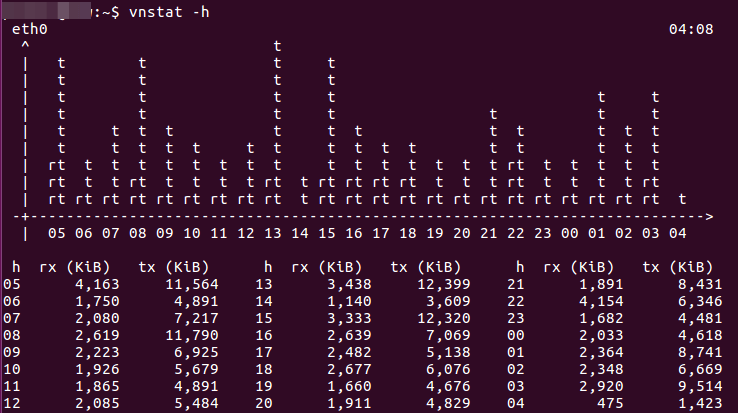
vnstat -h
With this command, you can find out what time of the day your Web site sustains the most traffic. Again, r stands for Receive which is incoming traffic; t stands for transmit which is outgoing traffic.

View Daily Network Traffic
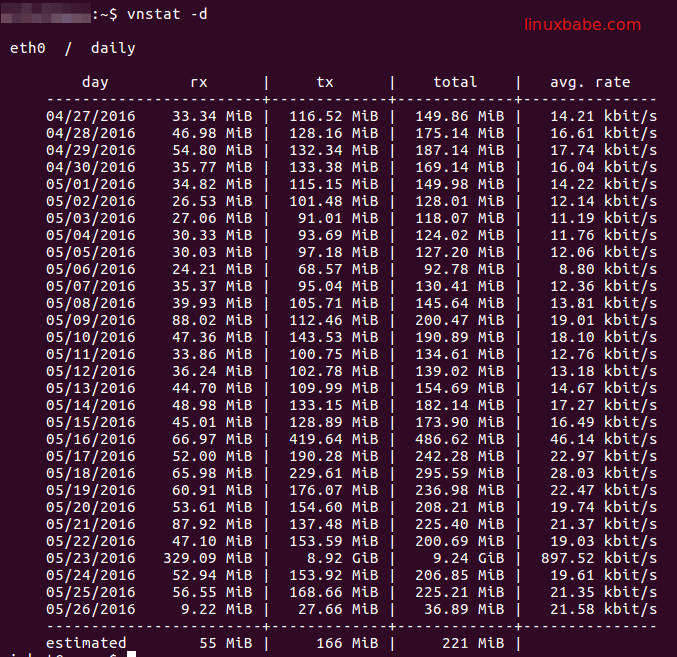
vnstat -d
This command will show the daily traffic statistics for the last 30 days.

View Weekly Traffic
vnstat -w
This command shows network traffic statistics of the last 7 days, last week, and current week.

View Monthly Network Traffic
vnstat -m

Please note that Apr '16 in the above screen means April 2016. At first glance, I thought it means April 16th. If you don’t like this format, you can change it by editing the vnstat config file.
sudo nano /etc/vnstat.conf
Find the 19th line.
MonthFormat "%b '%y"
Change the lower case y to upper case Y. You can also remove the ' character. Save and close the file. Run vnstat -m command again. Now you can see clearly that it means year 2016.
%y and %Y are two Unix date format strings. %y only output the last two digits of year (16) whereas %Y outputs the entire 4 digits of year (2016).
Show Top 10 Days
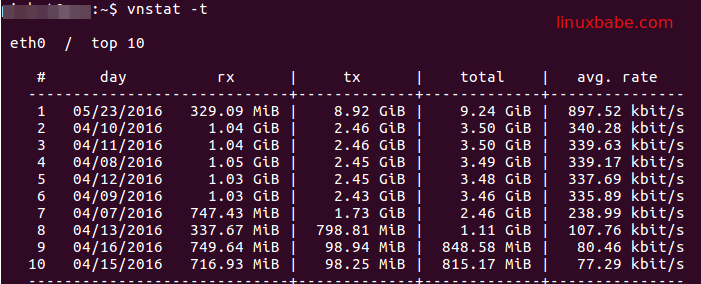
vnstat -t

Rate Unit
To change the rate unit, use -ru (rate unit) option. For instance, to view live traffic in bytes, add number 0 as the parameter to -ru option.
vnstat -i wlp3s0 -l -ru 0

To view traffic in bits, add number 1 as the parameter to -ru option.
vnstat -i wlp3s0 -l -ru 1


Thanks!